

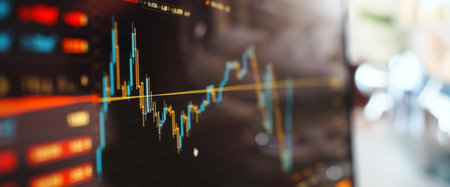
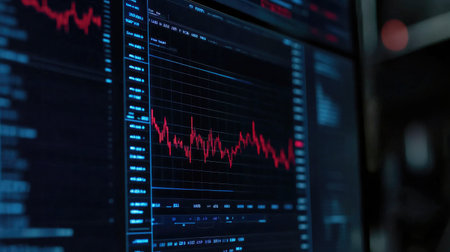
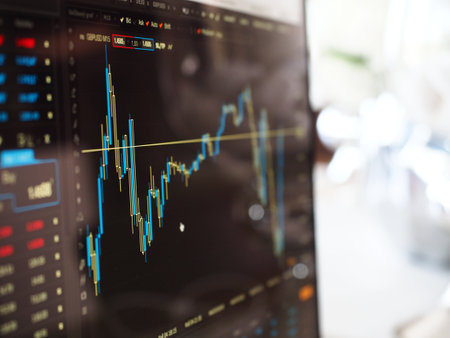
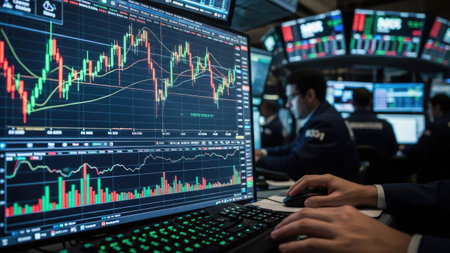
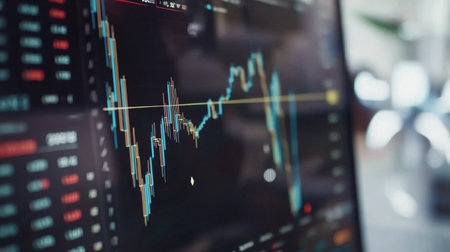
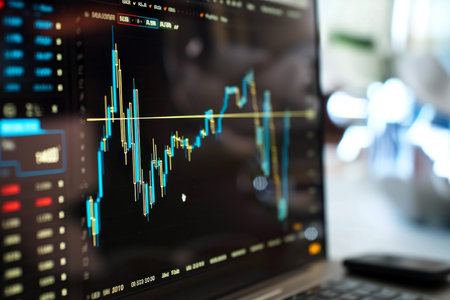
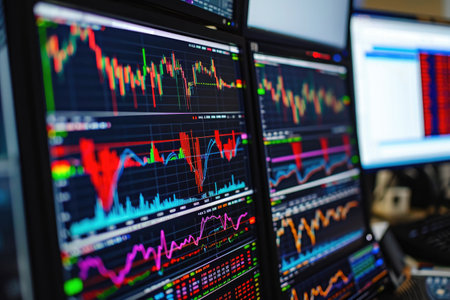
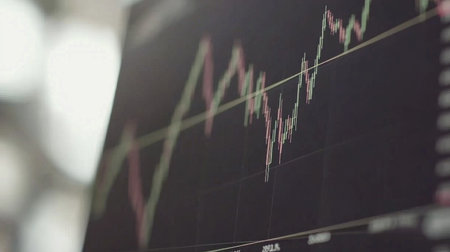
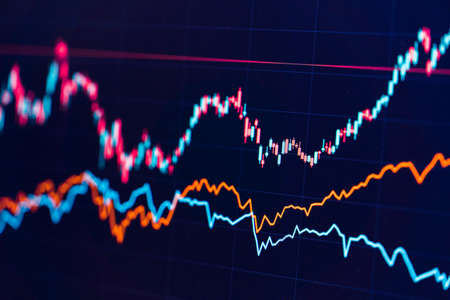
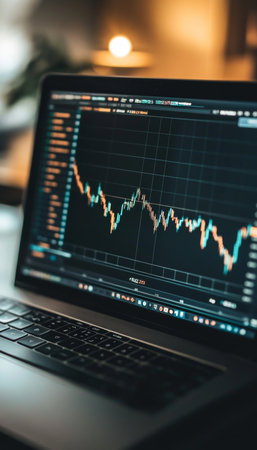
Candle stick graph chart with indicator showing bullish point or bearish point, up trend or down trend of price of stock market or stock exchange trading, investment and financial concept.
Коллекция по умолчанию
Коллекция по умолчанию
Создать новую

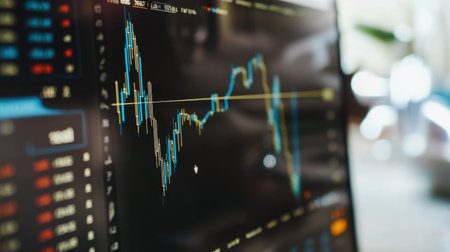
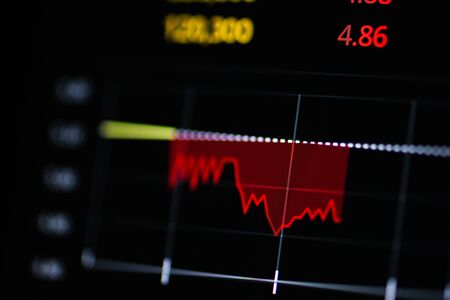
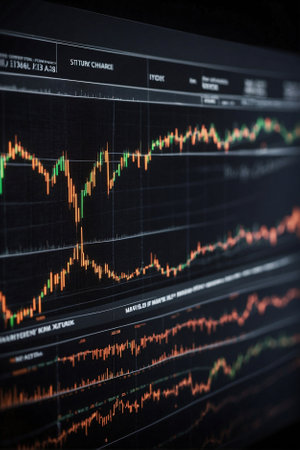
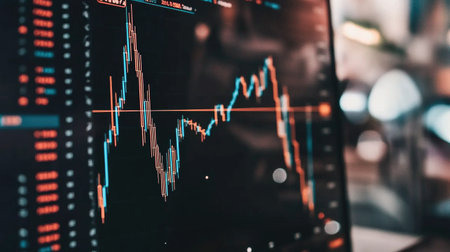
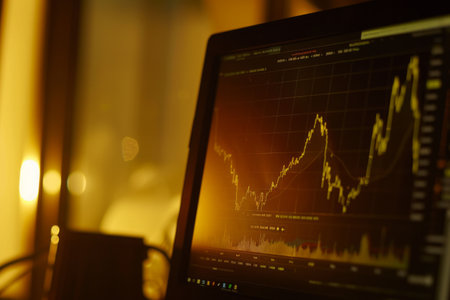
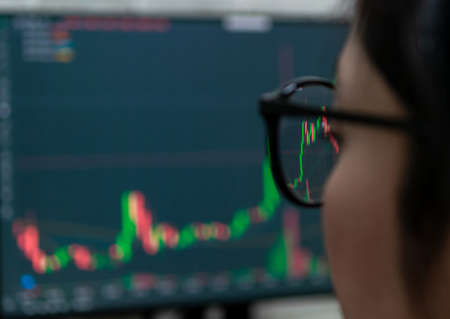
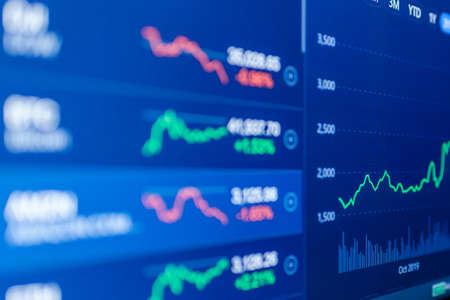
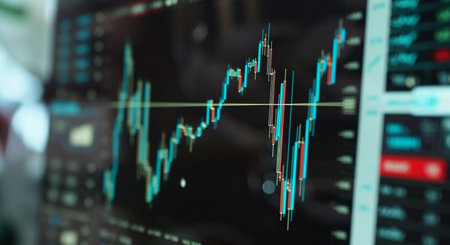
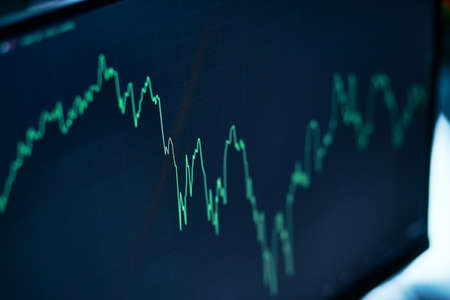
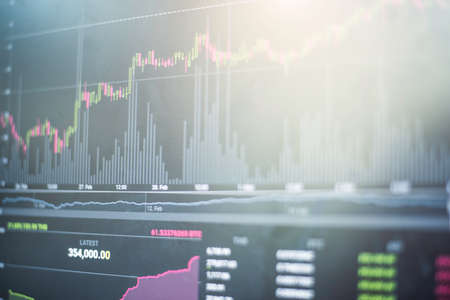
Shallow depth of field (selective focus) with details of a chart showing the stock market crash from March 2020 due to the Covid-19 pandemic on a computer screen (S&P500 index)
Коллекция по умолчанию
Коллекция по умолчанию
Создать новую
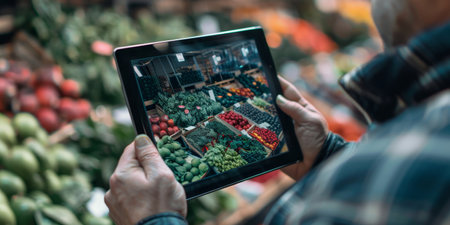
A man is holding a tablet in front of a produce stand
Коллекция по умолчанию
Коллекция по умолчанию
Создать новую

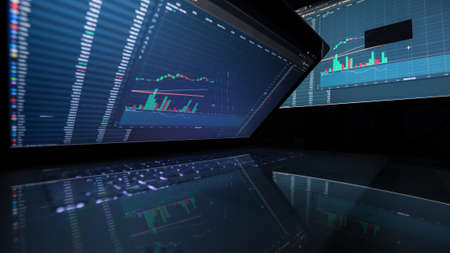
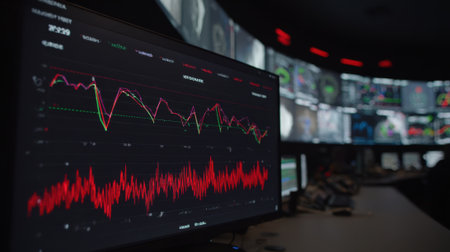
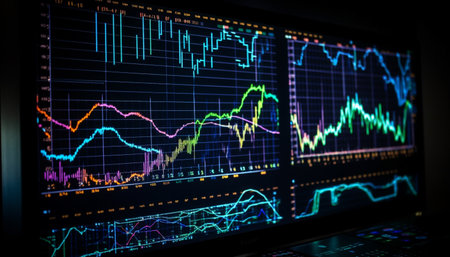
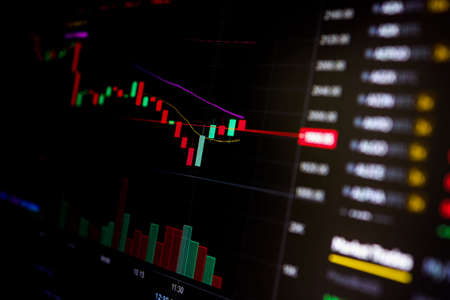
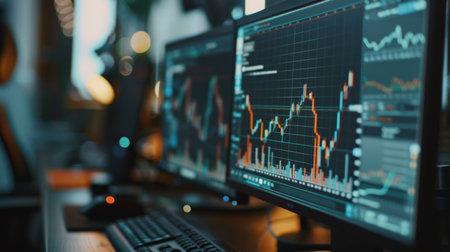
Financial data on a monitor,Stock market data on LED display concept
Коллекция по умолчанию
Коллекция по умолчанию
Создать новую
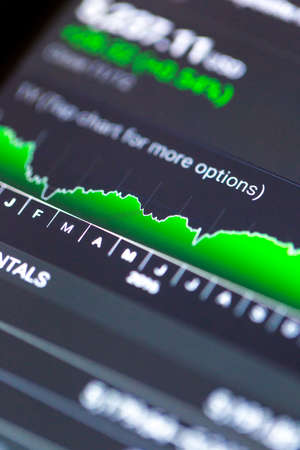
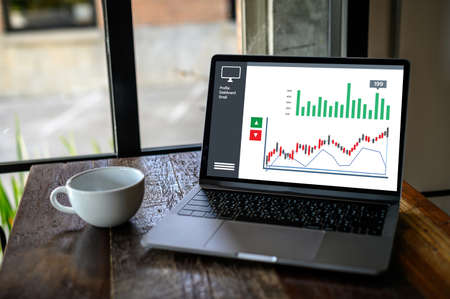
A financial chart illustrates a notable surge in stock market profits, fueled by rising interest rates and consistent growth in money investments during recent months.
Коллекция по умолчанию
Коллекция по умолчанию
Создать новую

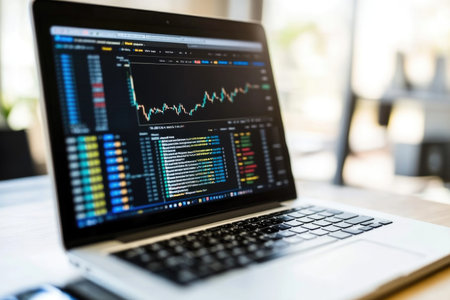
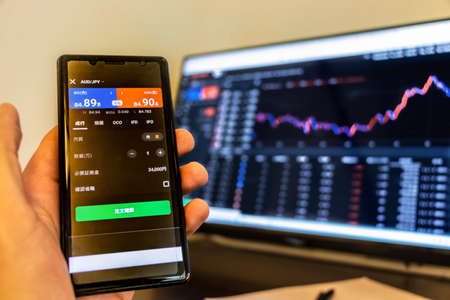
Online stock exchange application with information on screen, closeup
Коллекция по умолчанию
Коллекция по умолчанию
Создать новую

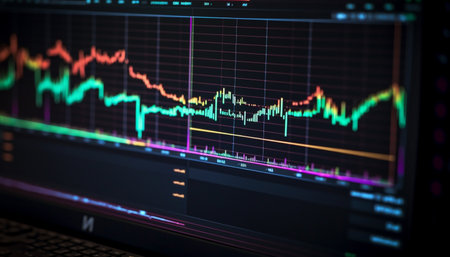
image of the financial graph on a computer monitor.
Коллекция по умолчанию
Коллекция по умолчанию
Создать новую

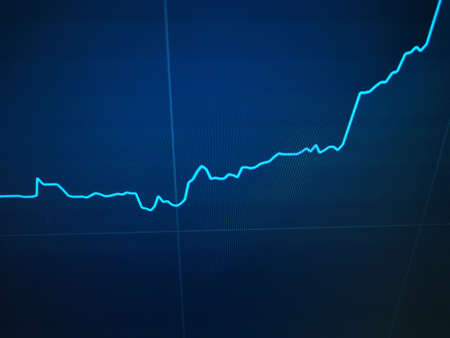
A stock market graph on a black background.
Коллекция по умолчанию
Коллекция по умолчанию
Создать новую
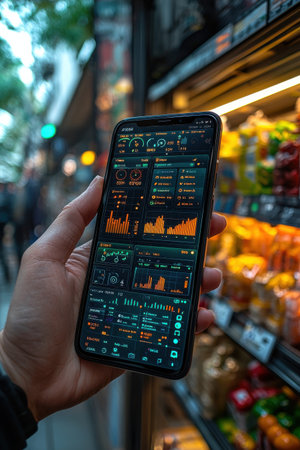
Person Using Smartphone App With Data Analytics Display in Urban Setting
Коллекция по умолчанию
Коллекция по умолчанию
Создать новую

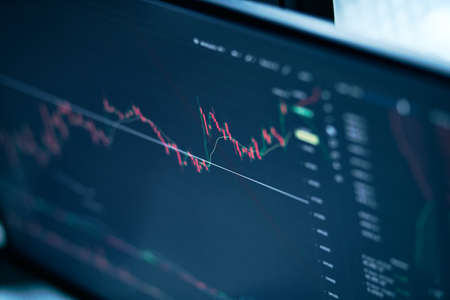
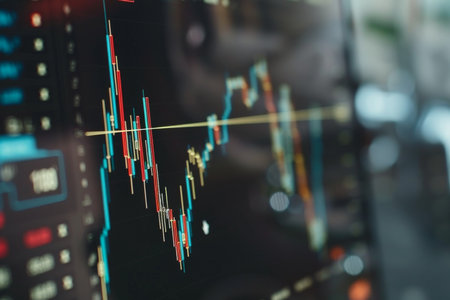
Financial stock market graph. Stock Exchange. Selective focus.
Коллекция по умолчанию
Коллекция по умолчанию
Создать новую
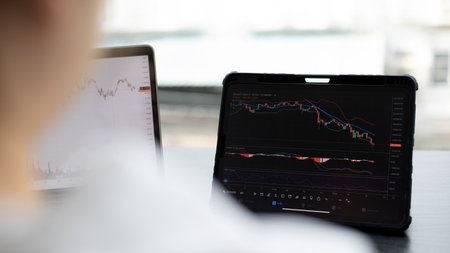
Detailed shot of a stock chart with market trends and performance metrics displayed on a tablet or laptop
Коллекция по умолчанию
Коллекция по умолчанию
Создать новую

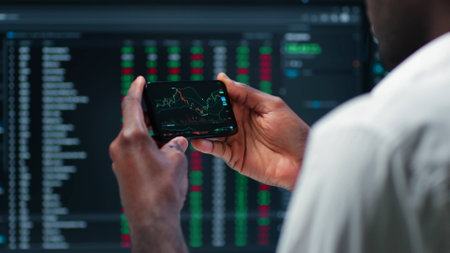
Trader investor broker holding finger using cell phone app executing financial stock trade market trading order to buy or sell
Коллекция по умолчанию
Коллекция по умолчанию
Создать новую
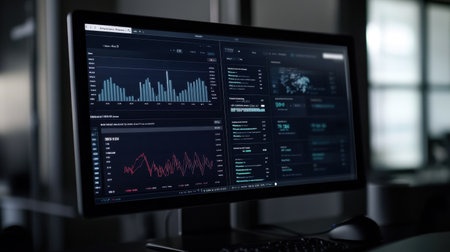
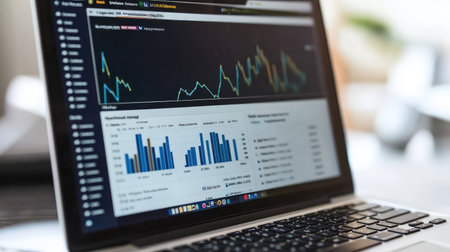
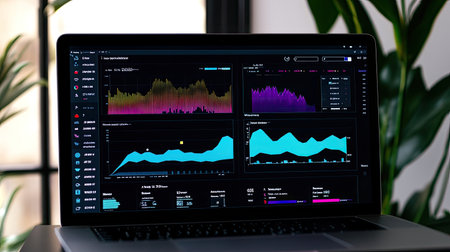
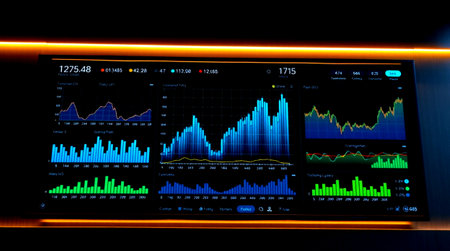
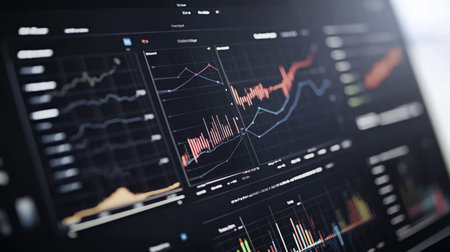
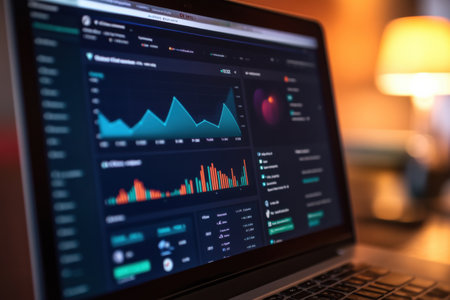
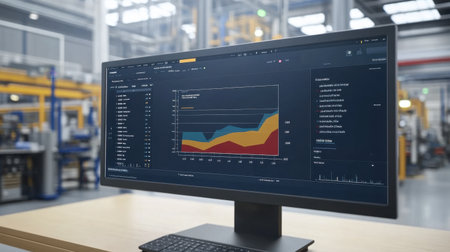
High-resolution image of a sleek data dashboard on a computer monitor showcasing financial analysis with various statistical graphs and trends.
Коллекция по умолчанию
Коллекция по умолчанию
Создать новую

graph of financial growth on a computer monitor.
Коллекция по умолчанию
Коллекция по умолчанию
Создать новую
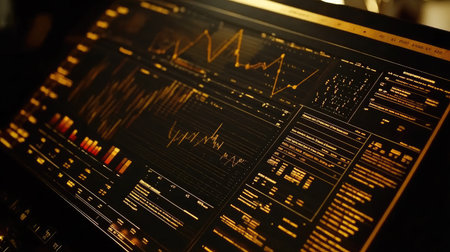
A vibrant image of a large monitor displaying a detailed gold price chart with various technical indicators and a prominent upward trend in gold prices.
Коллекция по умолчанию
Коллекция по умолчанию
Создать новую
Thailand Stock Exchange, Streaming Trade Screen, The stock screen shows a list of stocks with reduced value.
Коллекция по умолчанию
Коллекция по умолчанию
Создать новую

Financial instruments with various types of indicators including volume analysis for professional technical analysis
Коллекция по умолчанию
Коллекция по умолчанию
Создать новую
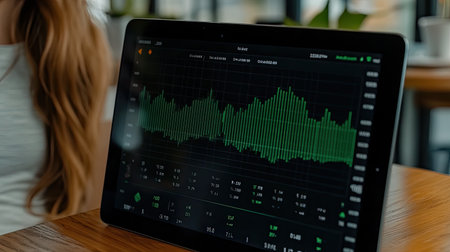
A close-up of a rising stock chart on a tablet screen, showing significant investment growth.
Коллекция по умолчанию
Коллекция по умолчанию
Создать новую
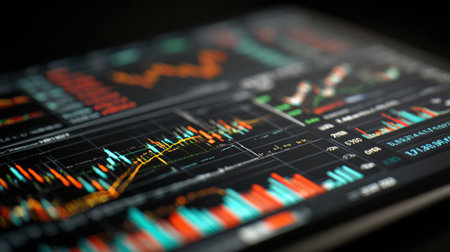
Abstract image of financial data and stock market analysis with colorful graphs and charts, representing economic trends and market fluctuations.
Коллекция по умолчанию
Коллекция по умолчанию
Создать новую
Close-up view of a laptop displaying data analysis with charts and graphs, perfect for showcasing technology, finance, or business analytics themes.
Коллекция по умолчанию
Коллекция по умолчанию
Создать новую
View of Stock Market Crash from Covid-19 Pandemic with shallow depth of field.
Коллекция по умолчанию
Коллекция по умолчанию
Создать новую
graph of financial growth on a computer monitor. cryptocurrency.
Коллекция по умолчанию
Коллекция по умолчанию
Создать новую

The Stock Exchange, Streaming Trade Screen, The stock screen shows a list of stocks with reduced value.
Коллекция по умолчанию
Коллекция по умолчанию
Создать новую
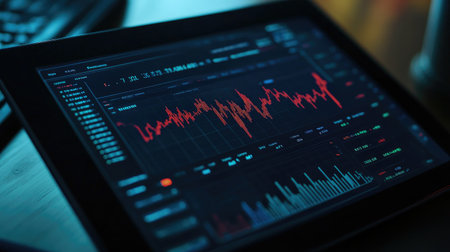
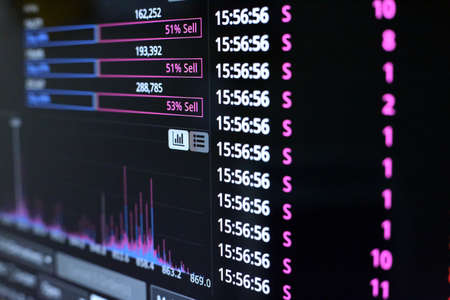
Close-up of stock market data displayed on a digital interface, featuring red trend lines and charts. Ideal for finance and technology themes.
Коллекция по умолчанию
Коллекция по умолчанию
Создать новую
Busy trading floor with traders communicating and screens showing market data and charts AI generated
Коллекция по умолчанию
Коллекция по умолчанию
Создать новую
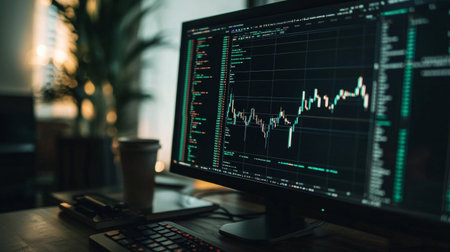
Laptop screen with stock market charts. Technical analysis and fundamental indicators of stock quotes in the trading terminal. Japanese candlesticks and company tickers.
Коллекция по умолчанию
Коллекция по умолчанию
Создать новую
Close-up of a sophisticated data visualization dashboard featuring various graphs and analytics for monitoring performance and trends in real-time.
Коллекция по умолчанию
Коллекция по умолчанию
Создать новую
A sleek laptop shows a modern digital dashboard with colorful data visualizations and analytics, set in a contemporary workspace, perfect for business insights.
Коллекция по умолчанию
Коллекция по умолчанию
Создать новую
Stock Market Chart on Dark Background: Financial Analytics. Digital Art: Modern Technologies
Коллекция по умолчанию
Коллекция по умолчанию
Создать новую
A desktop monitor displaying stock market analysis, financial graphs, and real-time data. The image conveys finance, trading, and business strategy themes, ideal for financial and corporate topics.
Коллекция по умолчанию
Коллекция по умолчанию
Создать новую
Displaying digital interface overlaying corporate corridor, with line graph, tickers and dashboards. Technology, analytics, innovation, business, data visualization, finance, modern
Коллекция по умолчанию
Коллекция по умолчанию
Создать новую
Stock market or forex trading graph and candlestick chart suitable for financial investment concept. Economy trends background for business idea and all art work design. Abstract finance background.
Коллекция по умолчанию
Коллекция по умолчанию
Создать новую
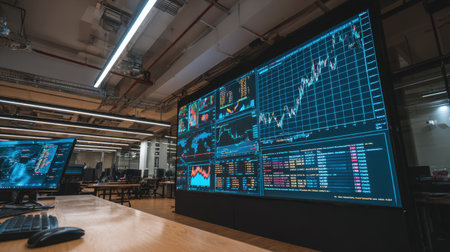
A modern financial office featuring large display screens with stock market trends and analytics, showcasing real-time data in a sleek and contemporary environment.
Коллекция по умолчанию
Коллекция по умолчанию
Создать новую

financial graph on monitor for business and finance concept. shallow depth of field
Коллекция по умолчанию
Коллекция по умолчанию
Создать новую
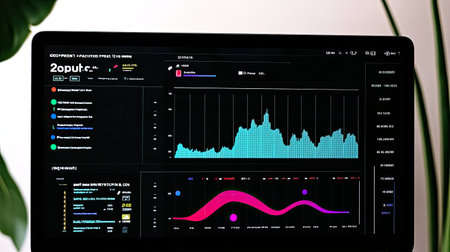
A sleek digital dashboard showcasing market analysis with engaging charts. Ideal for professionals seeking insights into financial performance and trends.
Коллекция по умолчанию
Коллекция по умолчанию
Создать новую

Financial stock market graph. Stock Exchange. Selective focus.
Коллекция по умолчанию
Коллекция по умолчанию
Создать новую
Working set for analyzing financial statistics and analyzing a market data. Data analysis from charts and graphs
Коллекция по умолчанию
Коллекция по умолчанию
Создать новую
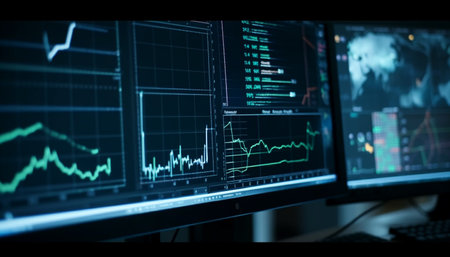
A close-up view displays a computer monitor showcasing financial charts and graphs indicative of market analysis. The screen is illuminated, highlighting data points and trend lines, suggesting investment strategies and economic forecasting. The image's use could be beneficial for articles concerning market trends or business publications.
Коллекция по умолчанию
Коллекция по умолчанию
Создать новую

Business financial or stock market background. Business graph on stock market financial exchange
Коллекция по умолчанию
Коллекция по умолчанию
Создать новую
A close-up view of an interactive stock trading chart on a tablet, showing candlestick patterns and technical indicators in a well-lit environment.
Коллекция по умолчанию
Коллекция по умолчанию
Создать новую

Data analyzing in Forex, Commodities, Equities, Fixed Income and Emerging Markets: the charts and summary info show about Business statistics and Analytics value - Wealth management concept.
Коллекция по умолчанию
Коллекция по умолчанию
Создать новую
A close-up shot of a stock market chart displayed on a laptop screen, showing financial data and market trends.
Коллекция по умолчанию
Коллекция по умолчанию
Создать новую
Closeup medium shot of a digital screen showing predictive maintenance graphs and alert notifications with an outoffocus control room behind.
Коллекция по умолчанию
Коллекция по умолчанию
Создать новую
A close-up view of a stock market graph displayed on a digital screen. The data visualizations showcase market trends, fluctuations, and investment analytics in a modern workspace setting.
Коллекция по умолчанию
Коллекция по умолчанию
Создать новую

Indicators including volume analysis for professional technical analysis on the monitor of a computer. Fundamental and technical analysis concept.
Коллекция по умолчанию
Коллекция по умолчанию
Создать новую
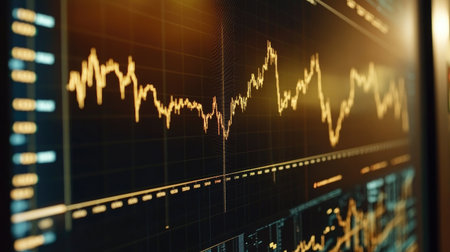
A close-up of a financial graph on a computer monitor showing stock market trends with peaks and troughs in warm light.
Коллекция по умолчанию
Коллекция по умолчанию
Создать новую
Futuristic computer graphic design analyzing wealth growth and balance generated by artificial intelligence
Коллекция по умолчанию
Коллекция по умолчанию
Создать новую
A detailed financial chart with currency trading trends and technical analysis tools for investors focused on maximizing portfolio profitability --chaos 70
Коллекция по умолчанию
Коллекция по умолчанию
Создать новую
Stock market data analyzing graph showing on laptop screen with shallow depth of field
Коллекция по умолчанию
Коллекция по умолчанию
Создать новую
Business trading stocks in finance and investment.
Коллекция по умолчанию
Коллекция по умолчанию
Создать новую
Stock exchange, cryptocurrency price chart on a screen. Candlestick chart, btc. Online currency exchange market. Trading, bidding. Tracking the cryptocurrency rate. 4K. Close up.
Коллекция по умолчанию
Коллекция по умолчанию
Создать новую
Minimalist Financial Analysis on Laptop with Stock Market Charts.
Коллекция по умолчанию
Коллекция по умолчанию
Создать новую
A computer screen showing multiple screens with various applications and windows open, Images of stocks and shares displayed on multiple computer screens, AI Generated
Коллекция по умолчанию
Коллекция по умолчанию
Создать новую
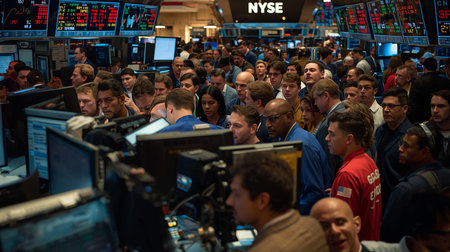
This image depicts a large room that is packed with numerous monitors, presenting an efficient setup for enhanced visual display, Busy New York Stock Exchange trading floor, AI Generated
Коллекция по умолчанию
Коллекция по умолчанию
Создать новую
Global business thrives on technology, data, and communication frequencies generated by artificial intelligence
Коллекция по умолчанию
Коллекция по умолчанию
Создать новую
Grow Stock market trading graph in graphic concept.financial investment or economic trends business design. Abstract finance background.Low angle shot.
Коллекция по умолчанию
Коллекция по умолчанию
Создать новую
Stock market chart on LED display, stock market data analysis concept.
Коллекция по умолчанию
Коллекция по умолчанию
Создать новую

Financial stock market graph. Stock Exchange. Selective focus.
Коллекция по умолчанию
Коллекция по умолчанию
Создать новую
Stock market chart on digital screen. Business, finance and investment concept.
Коллекция по умолчанию
Коллекция по умолчанию
Создать новую
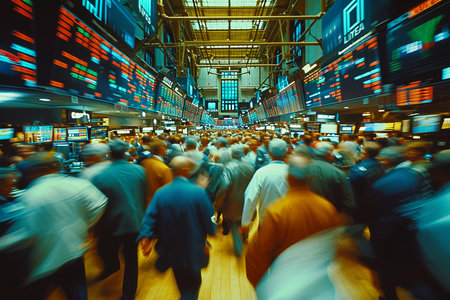
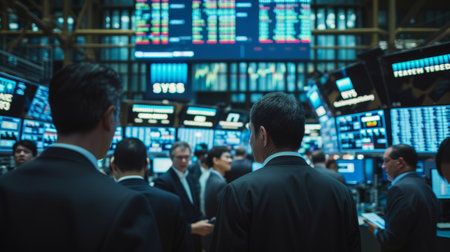
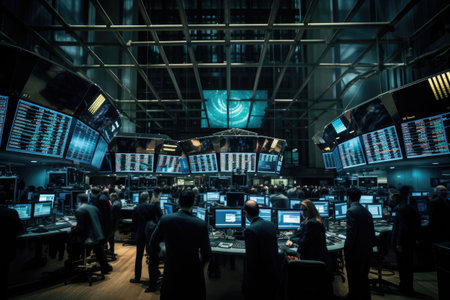
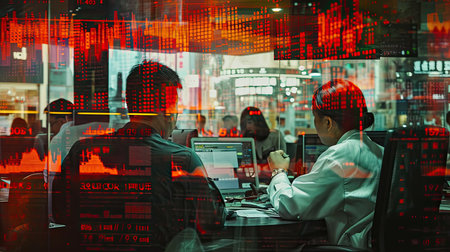
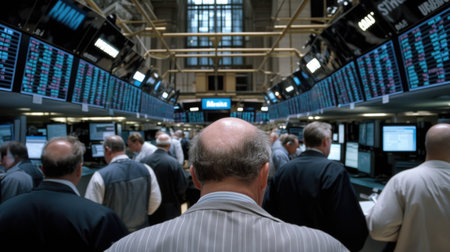
This image captures the dynamic movement and energy of a stock exchange floor. Traders move briskly, their figures blurred in motion, against a backdrop of large digital boards displaying live stock prices. The high ceiling and structural design of the building add to the grandeur of this hub of financial activity.
Коллекция по умолчанию
Коллекция по умолчанию
Создать новую
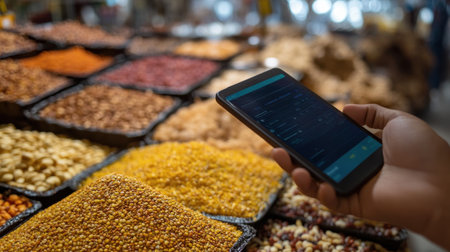
A person interacts with a smartphone while exploring a vibrant market stall filled with an array of colorful nuts, spices, and dried fruits, showcasing modern shopping amidst traditional offerings.
Коллекция по умолчанию
Коллекция по умолчанию
Создать новую
A man is sitting in front of a computer monitor with a black
Коллекция по умолчанию
Коллекция по умолчанию
Создать новую
Factory dashboard with real-time alerts, maintenance schedule, and energy usage displayed
Коллекция по умолчанию
Коллекция по умолчанию
Создать новую

A busy supermarket scene showcasing shoppers navigating through aisles filled with products and digital displays.
Коллекция по умолчанию
Коллекция по умолчанию
Создать новую
Stock market, blur computer screen and financial graphs for trading, trends analytics or global exchange chart. Fintech, monitor or economy data for growth algorithm, profit patterns or revenue stats
Коллекция по умолчанию
Коллекция по умолчанию
Создать новую
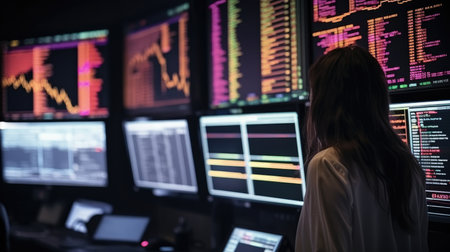
Financial analysts are in their offices, focusing on market data and providing accurate investment advice to clients.
Коллекция по умолчанию
Коллекция по умолчанию
Создать новую
Close-up view of a modern digital interface showcasing various data visualizations, including charts and graphs, ideal for business and analytics contexts.
Коллекция по умолчанию
Коллекция по умолчанию
Создать новую
A close-up of a stock chart with candlestick patterns, showing a significant upward trend. The chart is placed over a blurred background with financial data scrolling past.
Коллекция по умолчанию
Коллекция по умолчанию
Создать новую
Businesswoman checking stock market in downtown financial district, Financial graph chart global recession bump dump risk management.
Коллекция по умолчанию
Коллекция по умолчанию
Создать новую
A computer monitor displays a graph of stock prices. The graph shows a downward trend, with the stock prices dropping significantly. Scene is one of concern and uncertainty
Коллекция по умолчанию
Коллекция по умолчанию
Создать новую
Investors sit and watch graphs of stock market data and watch the world market chart change, Investing in cryptocurrency in the stock market, Business people work on tablets and laptops.
Коллекция по умолчанию
Коллекция по умолчанию
Создать новую
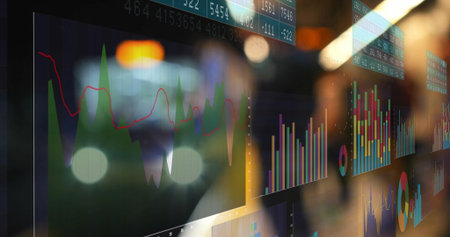
Financial concept and stock market trading - economic forecast, business strategy, digital display, investment trends, market analysis, corporate data, exchange platform, trader insight
Коллекция по умолчанию
Коллекция по умолчанию
Создать новую
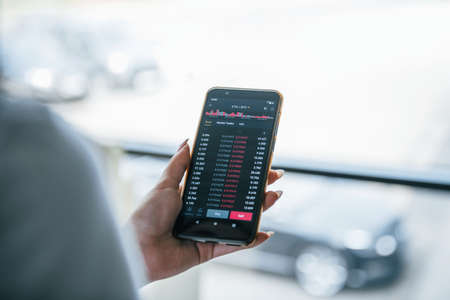
Close up view of phone holding by woman with business and exchange information.
Коллекция по умолчанию
Коллекция по умолчанию
Создать новую
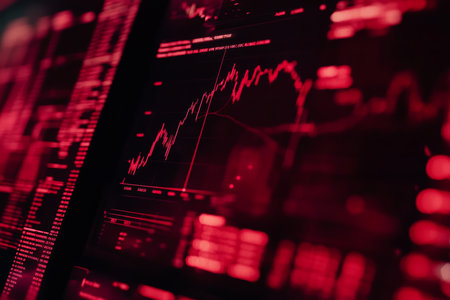
Dynamic digital interface illustrating stock market trends with red highlights and data analysis
Коллекция по умолчанию
Коллекция по умолчанию
Создать новую
The dynamics of changes in currencies. Price growth chart and economic recovery
Коллекция по умолчанию
Коллекция по умолчанию
Создать новую
Graphs and charts representing financial metrics and trends are shown on a sleek laptop in a warmly lit room during the evening.
Коллекция по умолчанию
Коллекция по умолчанию
Создать новую
Cropped shot of male stock market broker analyzing graphs on smartphone
Коллекция по умолчанию
Коллекция по умолчанию
Создать новую
Bitcoin is an open source peer-to-peer electronic cash system that uses blockchain technology
Коллекция по умолчанию
Коллекция по умолчанию
Создать новую
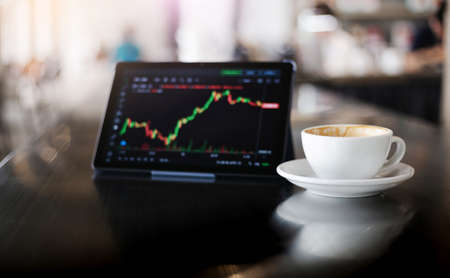
Soft focus of white coffee cup and blur digital tablet with cryptocurrency graph on screen
Коллекция по умолчанию
Коллекция по умолчанию
Создать новую
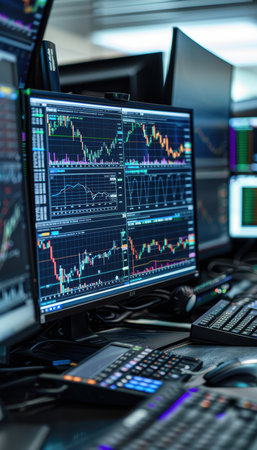
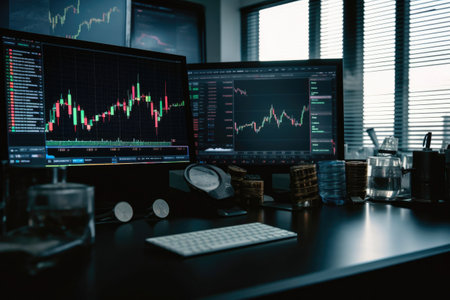
High-Tech Financial Analyst Workspace with Stock Market Data and Graphical Displays
Коллекция по умолчанию
Коллекция по умолчанию
Создать новую
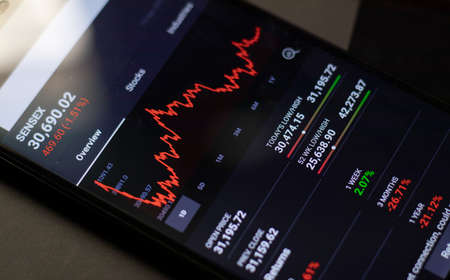
Maski, India - April 14, 2020 : Crash in sensex share market on mobile during covid-19 lockdown.
Коллекция по умолчанию
Коллекция по умолчанию
Создать новую

Vibrant candlestick patterns and descending trend lines illustrate a market downturn, highlighting analysis tools amid a somber financial atmosphere.
Коллекция по умолчанию
Коллекция по умолчанию
Создать новую

Tourist taking pictures of local market in Hong Kong
Коллекция по умолчанию
Коллекция по умолчанию
Создать новую
Business trader trading graph of stock market investment selling and buying with finance chart data graphs on computer. Generative AI
Коллекция по умолчанию
Коллекция по умолчанию
Создать новую

A detailed close-up view of a candlestick chart displaying stock data. The graphic illustrates financial trends with vibrant colors, aiding data analysis.
Коллекция по умолчанию
Коллекция по умолчанию
Создать новую
Financial stock market graph. Stock Exchange. Selective focus.
Коллекция по умолчанию
Коллекция по умолчанию
Создать новую
graph of financial growth on a computer monitor.
Коллекция по умолчанию
Коллекция по умолчанию
Создать новую
Close-up of a desktop monitor showing economic indicators and GDP growth graphs.
Коллекция по умолчанию
Коллекция по умолчанию
Создать новую

Woman hand Trading online on tablet with business paper and coffee
Коллекция по умолчанию
Коллекция по умолчанию
Создать новую
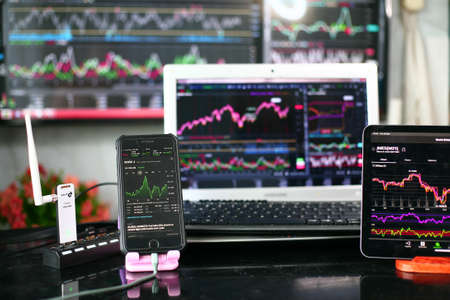
Forex trading using PC and smartphone
Коллекция по умолчанию
Коллекция по умолчанию
Создать новую
International Exhibition for Equipment, Technologies, Raw Materials and Raw Materials.
Коллекция по умолчанию
Коллекция по умолчанию
Создать новую

Business analytics with key performance indicators dashboard concept. Man hand on white background holds Mockup phone with white screen
Коллекция по умолчанию
Коллекция по умолчанию
Создать новую

Stock market candlestick chart, asset prices movement, currency exchange price action simple concept. Computer screen, display, candle chart, graph detail, extreme closeup, nobody, no people
Коллекция по умолчанию
Коллекция по умолчанию
Создать новую
Intricate trading analytics display lively graphs and charts reflecting trading activity and stock price movements during market hours.
Коллекция по умолчанию
Коллекция по умолчанию
Создать новую
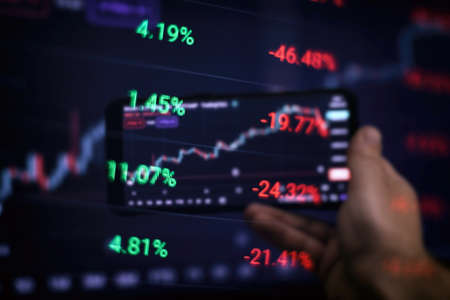
Business and trading finance contept. Stock exchange market chart view on smart phone screen.
Коллекция по умолчанию
Коллекция по умолчанию
Создать новую
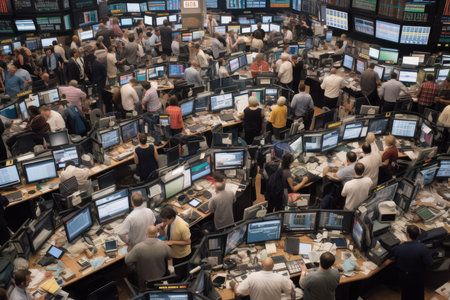
An aerial shot of a busy trading floor with people working in an office filled with computers, all looking at their screens. Generative Ai
Коллекция по умолчанию
Коллекция по умолчанию
Создать новую
Visual representation of financial growth and investment trends for enhanced decision making
Коллекция по умолчанию
Коллекция по умолчанию
Создать новую
Stock graph on computer on black background.
Коллекция по умолчанию
Коллекция по умолчанию
Создать новую
work hard Data Analytics Statistics Information Business Technology
Коллекция по умолчанию
Коллекция по умолчанию
Создать новую
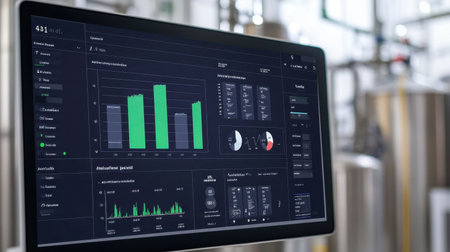
Advanced control dashboard showing real-time analytics in a smart manufacturing plant
Коллекция по умолчанию
Коллекция по умолчанию
Создать новую
Legion-Media
Создайте свои проекты на основе качественных стоковых фотографий и видео.


Copyright © Legion-Media.